Clean Pig?
Garrett Crochet has not had his ‘filth’ to start his 2026 campaign; has it washed away for good?

Pigs love their filth; usually, it is not hard for them to get comfortable and properly filthy. However, for the 2025 AL Cy Young runner-up, filth has come at a premium in the dawn of the 2026 campaign. Last season, Garret Crochet twirled a 2.59 ERA to go along with an MLB-leading 255 Ks. He also capped his previous career high in innings pitched by about 60. League-wide, LHP face LHB in ~30% of plate appearances. So far this year, Crochet has faced a LHB only 15% of the time. Managers have every right to avoid these matchups against Crochet this season; his OPS allowed against lefties last year was .447(4th best among pitchers with 90 LHB faced). Will Crochet be able to take control of his season before it sinks?
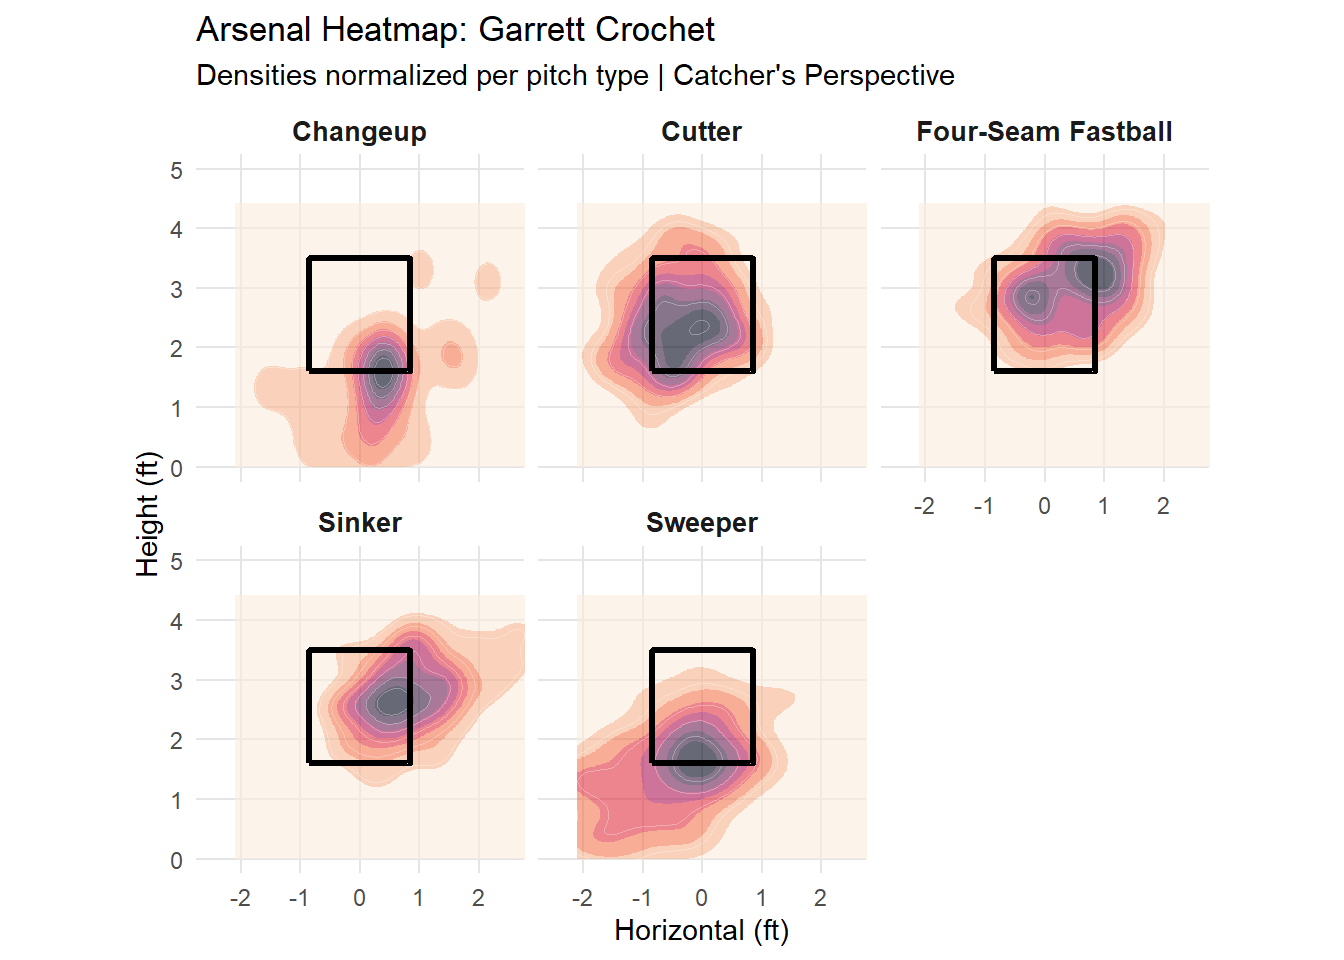
Last year, his go-to pitch in lefty-on-lefty matchups was the sweeper. This was one of the most devastating in the game, inducing a 39% swing-and-miss rate. That rate has fallen to 24% thus far in 2026, yet there is no corresponding drop in shape metrics that would indicate a drop in production. The velocity and spin of his sweeper have actually increased this year, creating more drop and more ‘sweep’ on the pitch. Well, there must be a reason for his ERA to balloon to 7.58; the reason can be found in the location metrics of his pitches. While it is a good sign that his velocity and spin metrics haven’t plummeted along with his ERA, this may be an explanation for his rocky start. Location metrics reveal a pitcher’s ability to execute a given pitch. His fastball location has been down across the board; his two dominant fastballs (cutters v. LHB and sinkers v. RHB) are down 9% and 6%, respectively, in pitches thrown in the shadow of the zone. Pitches thrown in the shadow of the zone are a necessity for fastballs, as they generate uncomfortable swings while still pumping the zone. Too many pitches over the heart of the plate result in solid contact, while too many out of the zone allow hitters to be selective. Overall, he threw 49% of his pitches in the zone last year and is on pace to only throw 43% in the zone this year.
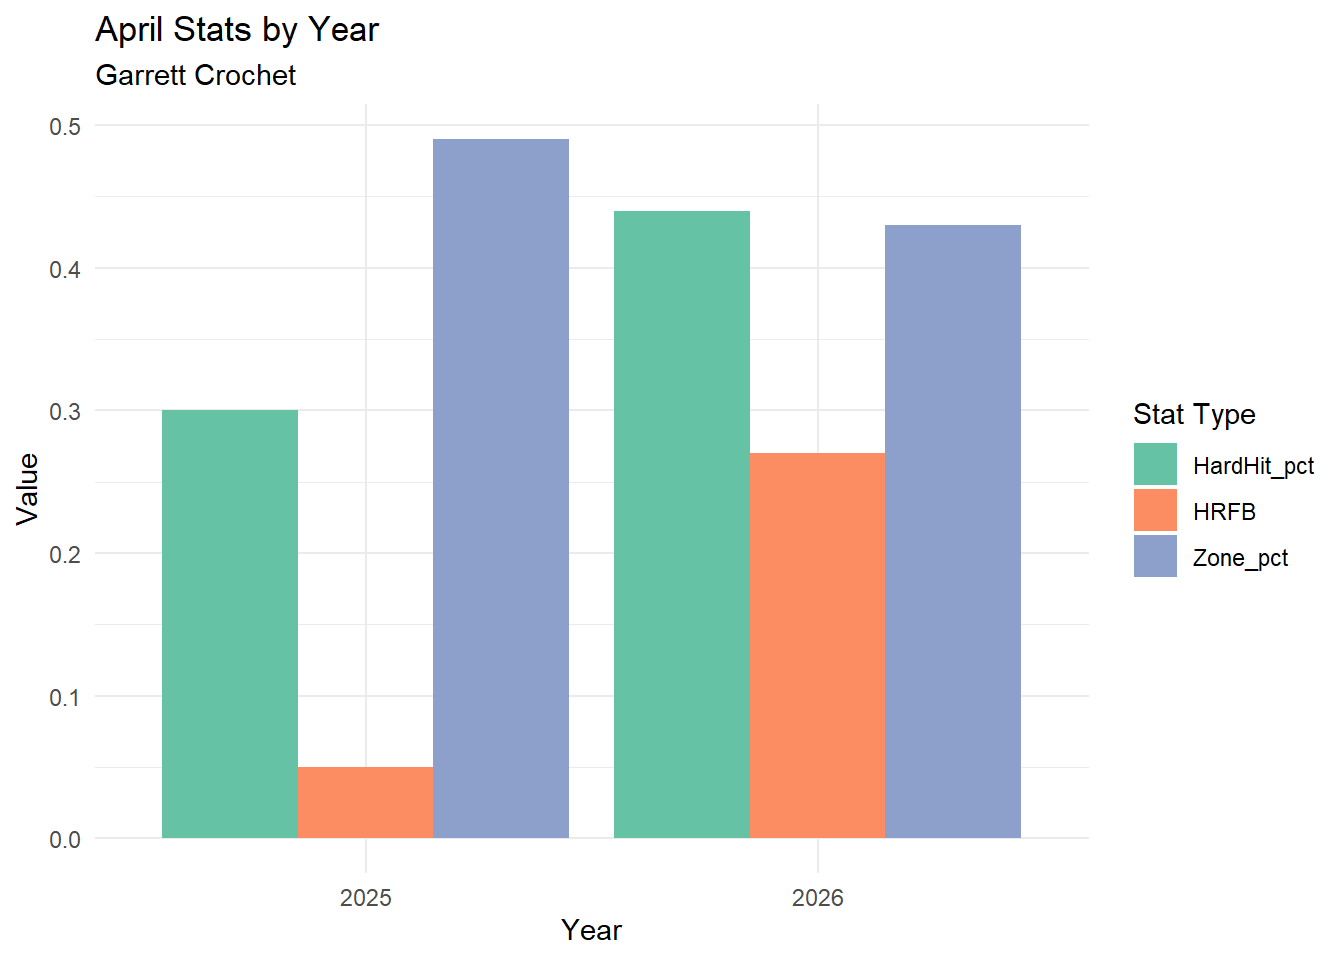
The main issue seems to be pitch location related; Crochet also had a below-average start locating his pitches in 2025. He allowed 3.68 walks per 9 innings last year from March to April, with the mark settling to 2.02 by the end of the year. The reason that no one seemed to care about last April’s command issues was because he kept up a 2.05 ERA during that stretch. Last year’s lack of location early was covered up by low-quality contact from opposing hitters. The month of April featured an especially low hard hit% of 30%, which is 7 points better than his next best month in 2025. His HR per fly ball rate was also minuscule at 5%; hitters did not take advantage last year when Crochet was having command issues.
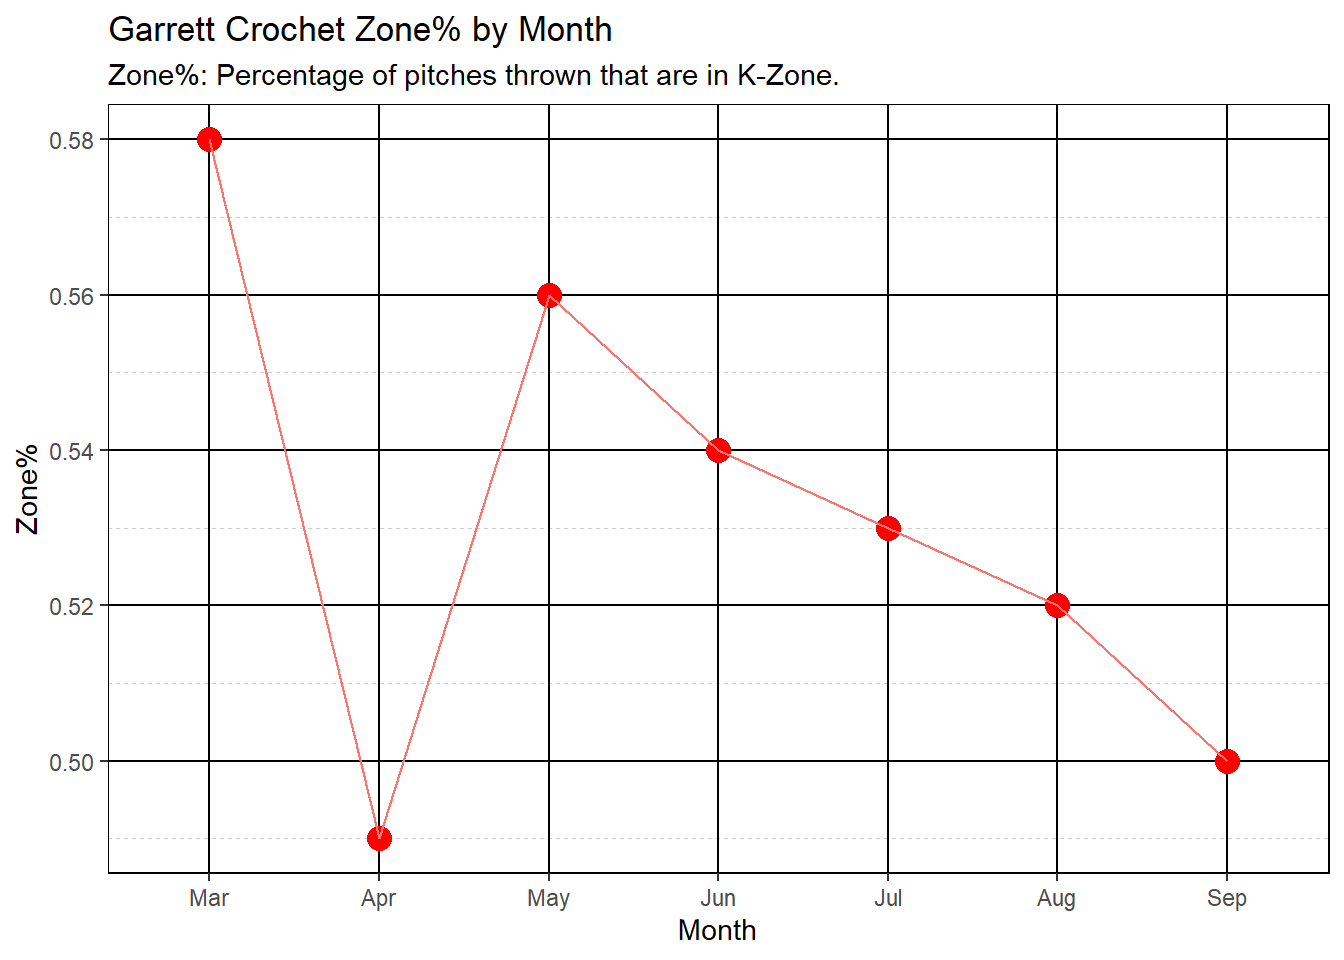
His pitches have stayed sharp even while holding an ERA in the mid-7s. He only has to work through command issues, especially when establishing the fastball. Following his shabby location in April, May saw his best location numbers in a full month all year. April showers truly did bring May flowers. Once Crochet, yet again, bounces back from early command struggles, question marks will soon fall away. If Crochet can complete 195 IP the full season while maintaining a 2.51 or better ERA, he can finish out the year with a sub-3 ERA. This expectation is not too far out of the picture, and the Pig’s season numbers may still be recoverable, even after the 10 ER allowed in 1 ⅔ IP against the Twins. However this graph also shows cause for late season concern. After his May spike, Crochet’s location consistently dropped as the season wore on; showing signs of wear in a 205 inning season.
Since 2011, 10 pitchers have held a sub-2.5 ERA in 195+ IP during their final 28 games. Will Crochet find his stuff to join these ranks?
| Name | Team | Date Began | Date Ended | ERA | IP | W | L | CG | SHO | Ks |
|---|---|---|---|---|---|---|---|---|---|---|
| Sandy Alcantara | MIA | 5/1/2022 | 9/30/2022 | 2.35 | 203.1 | 12 | 9 | 6 | 1 | 187 |
| Corey Kluber | CLE | 4/9/2017 | 9/30/2017 | 2.09 | 197.2 | 18 | 4 | 5 | 3 | 259 |
| Clayton Kershaw | LAD | 5/4/2015 | 10/4/2015 | 1.88 | 201.1 | 15 | 5 | 4 | 3 | 258 |
| Zack Greinke | LAD | 4/29/2015 | 10/3/2015 | 1.70 | 196.0 | 16 | 3 | 1 | 0 | 179 |
| David Price | DET,TOR | 4/27/2015 | 9/26/2015 | 2.35 | 195.2 | 17 | 4 | 3 | 1 | 203 |
| Jake Arrieta | CHC | 5/7/2015 | 10/2/2015 | 1.60 | 197.1 | 19 | 4 | 4 | 3 | 205 |
| Corey Kluber | CLE | 5/4/2014 | 9/26/2014 | 2.13 | 198.2 | 16 | 6 | 2 | 1 | 234 |
| Adam Wainwright | STL | 4/22/2014 | 9/22/2014 | 2.47 | 197.0 | 17 | 8 | 4 | 2 | 147 |
| Clayton Kershaw | LAD | 4/28/2013 | 9/27/2013 | 1.78 | 202.1 | 14 | 7 | 2 | 1 | 197 |
| David Price | TBR | 4/24/2012 | 9/30/2012 | 2.43 | 196.0 | 18 | 4 | 2 | 1 | 194 |